The Molecules Gateway lists 150,777 different entries. Of these, 1,031 are present in the seven different unfermented media used to cultivate the strains and derive from the complex ingredients (i.e. soy peptone, soluble starch, casein hydrolysate, yeast extract, meat extract, soybean meal and bacto-peptone ) used for media preparation. These molecules are labeled as such in the Molecules Gateway.
Annotation levels and annotation tools
As explained here, the annotations derive from a decision tree and are classified on the basis of their likely reliability from 1 (least reliable) to 6 stars (most reliable). In addition, a small number of molecules has received a 7-star score because they were identified using reference standards or manual curation. Finally, entries without any predicted molecule (0 stars) consist of two subgroups, depending on whether or not there is a molecular formula predicted by SIRIUS. The distribution of molecules by annotation level can be seen below.
Distribution of molecules according to annotation level. The pie on the right shows details of molecules within the 3–7 annotation levels.
The three annotation tools – Compound Discoverer (CD), MolDiscovery (MD) and MS2Query (MQ) – predicted molecules at very different rates, ranging from over one third of entries for CD to just 4% for MD. Of note, molecule prediction by a tool does not imply that the prediction is correct.
Number of molecules predicted by each annotation tool.
Frequency of molecules
Frequently occurring molecules are expected to represent medium components, molecules from primary metabolism or common specialized metabolites. Most molecules are present in a few extracts only, and only 3,120 molecules are contained in more than 200 extracts. See the frequency of molecules present in the 1–200 extract range.
Number of molecules found in a given number of extracts. Molecules present in >200 extracts are omitted from the analysis.
Taxonomic origin
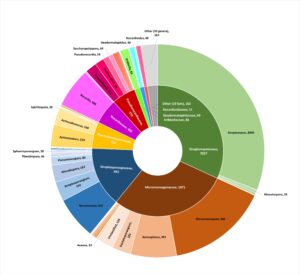
The Molecules Gateway derives from processing 7,440 extracts prepared from 6,566 different, 16S-classified strains. Of these, 6,354 are assigned to a total of 86 previously classified genera, while 212 strains belong to 12 undescribed genera.
Taxonomic distribution of extract-generating strains in the Molecules Gateway. The inner circle shows family level distribution (families with <50 strains are merged in a single group), while the outer lists genera with more than 20 strains. Numbers indicate number of strains.
All 98 genera contributed molecules, ranging from 199 for Embleya to 83,901 for Streptomyces. As expected, a correlation exists between the number of strains/extracts and the number of listed molecules. Of note, the same molecules can be produced by different genera.
Number of molecules deriving from the top 20 genera contributing to the Molecules Gateway. The numbers in brackets indicate strains and extracts, respectively, from each genus.
Molecular diversity
How different are the molecules listed? This question can be answered, by looking at the chemical relatedness and originating biosynthetic pathway for the 5,660 unique InChIKeys listed in the Molecules Gateway (1417 molecules arranged into families and 4243 molecules forming single nodes), and at the distribution of exact mass and retention time for the 58,093 molecules with 1 through 7 annotation confidence level. These analyses indicate that all major biosynthetic pathways are represented, that a limited number of closely related molecular families occurs and that there is no obvious bias in retention time or molecular weight.
Scatter plot correlating RT and exact mass for the 58,093 molecules annotated at the 1–7 confidence levels.
Demo Title
Demo Description
Introducing your First Popup. Customize text and design to perfectly suit your needs and preferences.